Gary, Indiana, a city known for its industrial history, has seen significant demographic shifts over the years. The industrial decline is a major reason for the significant changes we can see today. Let us talk about Gary, Indiana’s population in 2025 in greater detail.
Table of Contents
ToggleKey Takeaways
- Gary’s population is now 67,199, following years of decline.
- Demographics shifted, with a median age of 36.9, and balanced age and gender.
- Housing costs far exceed most residents’ income which is $32,934.
- Key industries offer jobs but often with low wages and instability.
- Seniors, especially those over 65, face housing struggles due to fixed incomes.
Population Overview
According to Indiana’s Public Data Utility, the city has experienced a significant decline in the population in the last couple of decades after a massive rise during the first few decades of the 20th century.
As of 2025, Gary, Indiana’s population is 67,199.
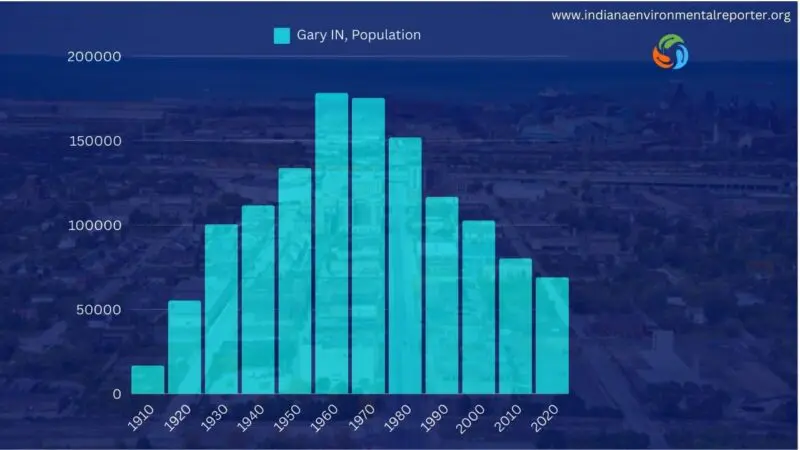
The city has lost around 0.67% of its population each year since 2020, when the headcount was 69,009.
For many, Gary’s decline isn’t surprising. Economic factors, migration patterns, and employment opportunities play a significant role in the dwindling numbers.
Race demographics
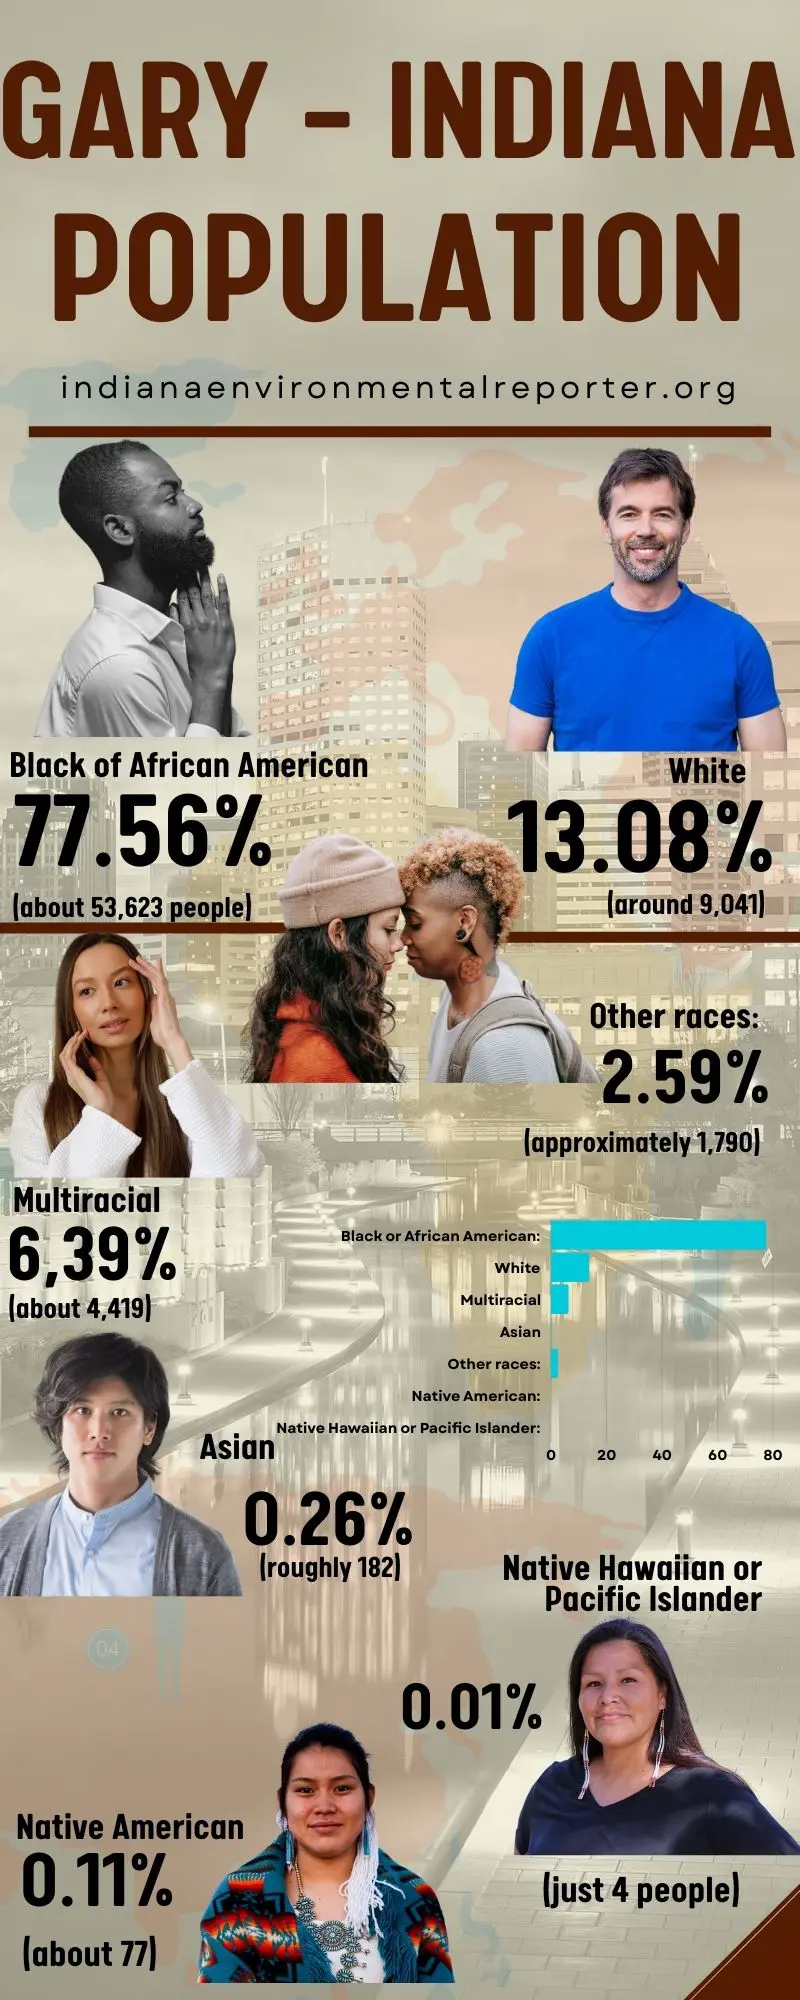
Race demographics are one of the major shifts the city has experienced during that period. Today, it looks like this:
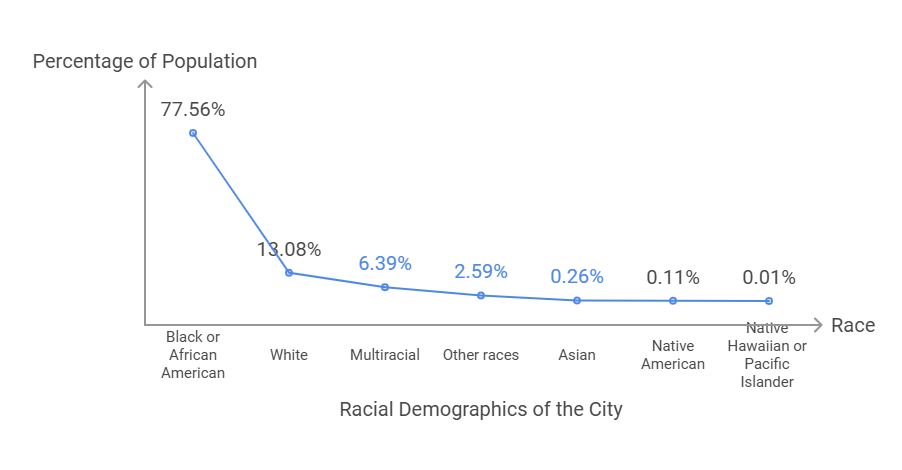
- Black or African American: 77.56% (about 53,623 people)
- White: 13.08% (around 9,041)
- Multiracial: 6.39% (about 4,419)
- Other races: 2.59% (approximately 1,790)
- Asian: 0.26% (roughly 182)
- Native American: 0.11% (about 77)
- Native Hawaiian or Pacific Islander: 0.01% (just 4 people)
Age and Gender Distribution
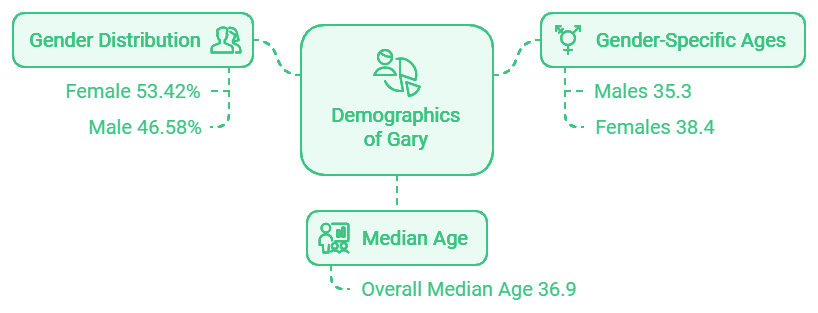
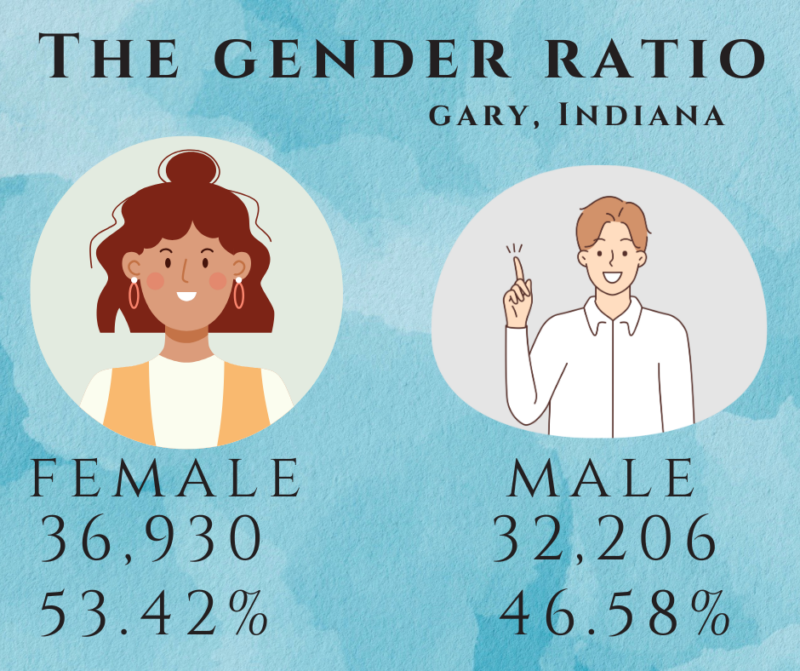
As stated by World Population Review, the median age in Gary is 36.9 years, indicating a relatively young population. Breaking it down, males have a median age of 35.3, while females are slightly older at 38.4. It’s also a city with a notable gender disparity — 53.42% of Gary’s population is female, compared to 46.58% male.
It basically looks like this:
| Age Group | Male | Female |
|---|---|---|
| Under 5 years | 2,691 | 2,174 |
| 5 to 9 years | 2,674 | 3,113 |
| 10 to 14 years | 2,781 | 2,448 |
| 15 to 19 years | 2,264 | 2,427 |
| 20 to 24 years | 2,016 | 2,264 |
| 25 to 29 years | 1,782 | 2,140 |
| 30 to 34 years | 1,723 | 2,345 |
| 35 to 39 years | 2,171 | 2,039 |
| 40 to 44 years | 1,280 | 2,438 |
| 45 to 49 years | 1,621 | 1,584 |
| 50 to 54 years | 2,104 | 2,008 |
| 55 to 59 years | 1,957 | 1,943 |
| 60 to 64 years | 1,806 | 2,555 |
| 65 to 69 years | 1,857 | 2,688 |
| 70 to 74 years | 1,525 | 1,837 |
| 75 to 79 years | 754 | 1,114 |
| 80 to 84 years | 719 | 828 |
| 85 years and over | 481 | 985 |
Earnings and Education

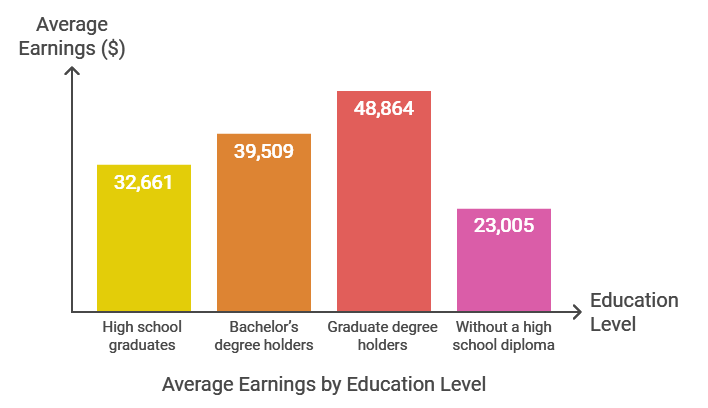
Income in Gary is tightly linked with educational attainment. Overall, the average income in the city is $32,934, but there’s more nuance to consider.
And education makes a noticeable difference:
- High school graduates: $32,661
- Bachelor’s degree holders: $39,509
- Graduate degree holders: $48,864
- Without a high school diploma: $23,005
Capital B News reported that Gary residents need an annual income of $50,160 or an hourly wage of $24.12 to afford a two-bedroom home. This disparity underscores the financial strain on many families trying to secure adequate housing.
“For the first time in recent history, less than a third of Indiana’s Top 20 largest occupations pay wages sufficient to meet the state’s Housing Wage,” said Andrew Bradley, senior director of policy and strategy at Prosperity Indiana. “Only a quarter of Hoosiers working in the state’s most popular occupations earn enough on average to afford rent.”
Poverty Rate
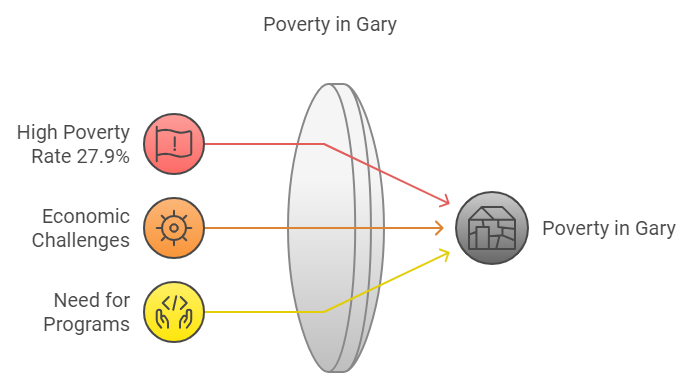
The breakdown becomes even more eye-opening when considering race and employment status.
By Race
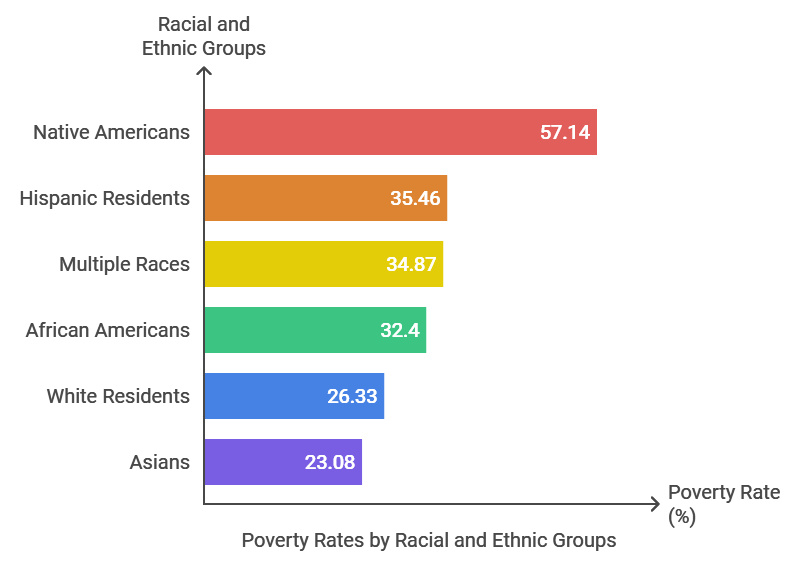
Native Americans face the highest poverty rate at 57.14%. Hispanic residents follow at 35.46%, and people of multiple races experience a 34.87% poverty rate. African Americans, the majority racial group, have a poverty rate of 32.4%.
Meanwhile, white residents are at 26.33%, and Asians have the lowest poverty rate at 23.08%.
By Employment
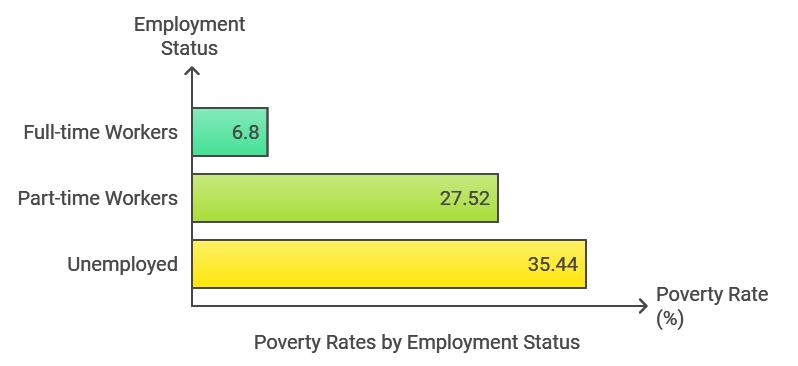
Among those with full-time work, the poverty rate is much lower, at 6.8%. However, part-time workers are at a 27.52% poverty rate, while those not working see an even higher rate of 35.44%.
Housing and Living Conditions
| Household Type | Total Households | Average Household Size | % Owner-Occupied | % Renter-Occupied |
|---|---|---|---|---|
| All | 27,612 | 2.48 | 48.3% | 51.7% |
| Non-Family | 11,768 | 1.16 | 51.1% | 48.9% |
| Female | 8,185 | 3.62 | 31.9% | 68.1% |
| Married | 5,661 | 3.35 | 70.2% | 29.8% |
| Male | 1,998 | 3.1 | 36.4% | 63.6% |
Married households have the highest homeownership rate at 70.2%, showing a strong tendency toward settling into owned homes. Non-family households are almost evenly split, with 51.1% owner-occupied and 48.9% renter-occupied.
Female-led households, however, are predominantly renters, with only 31.9% owner-occupied compared to 68.1% renting. Male-led households show similar trends, with 36.4% owning and 63.6% renting.
If you found this interesting read Is Gary as dangerous as people say?
Why are Housing and Living Conditions Important?
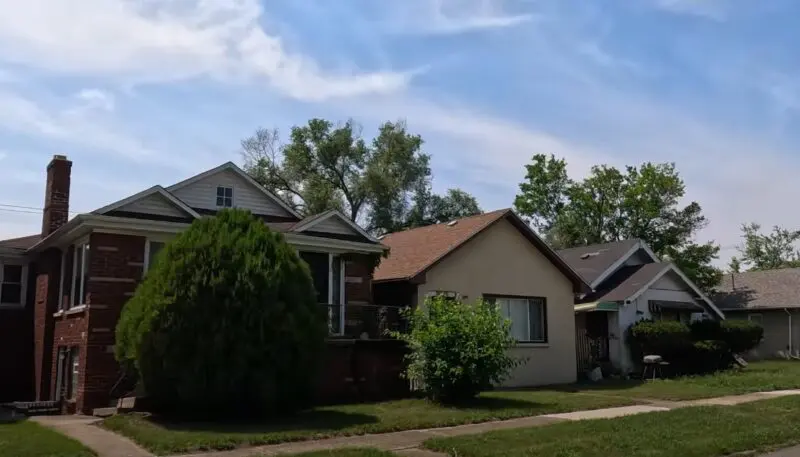
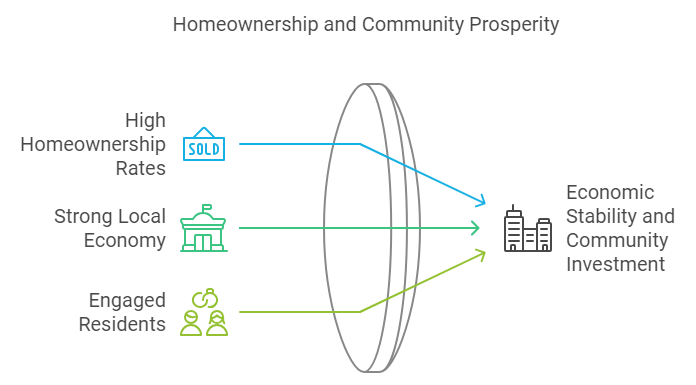
Good housing provides safety, stability, and comfort, which help reduce stress and improve physical and mental health. In contrast, poor housing conditions can lead to health issues, safety risks, and social isolation, affecting individual and community welfare.
This is vital for developing policies that promote:
- Affordable Housing: Ensuring that housing costs remain within reach for all residents, especially those with lower incomes.
- Improved Living Standards: Enhancing the quality of housing and access to essential services to improve residents’ overall well-being.
- Community Well-being: Creating a supportive environment that fosters community engagement and social cohesion.
How Does It Impact the Seniors?
Seniors typically face fixed incomes and rising healthcare costs, making affordable and stable housing even more critical.
Methodology
The statistics for Gary, Indiana, were derived from the latest 2024 census data projections and official reports, which analyzed population metrics, income levels, poverty rates, age demographics, educational attainment, language spoken, and veteran status.
Data were calculated using population sampling methods and annual growth rates, with specific breakdowns by race, gender, and employment status to provide a comprehensive view of the city’s socioeconomic landscape.
Sources
1. StatsIndiana – Indiana City/Town Census Counts, 1900 to 2020
2. World Population Review – Gary, Indiana Population 2024
Related Posts:
- Lafayette, Indiana Population Statistics 2025 -…
- Carmel Crime Rate 2025 - What the Latest Numbers Reveal
- Indiana Lung Cancer Statistics 2025: Key Data and Trends
- How to Use Reliable Data Sources for Climate and…
- Indianapolis Crime Rate in 2025 - An In-Depth Analysis
- Indiana Data Protection Act Explained: Simple…


