Fort Wayne, Indiana, experiences a diverse range of weather patterns throughout the year, making it an interesting location for climate enthusiasts. The city averages 38.1 inches of rainfall annually, placing it among the driest areas in Indiana. This rainfall is distributed across various months, with April typically being the wettest, aggregating up to 2.95 inches over approximately 15.6 days.
Summers in Fort Wayne are warm and humid, stretching from late May to mid-September, with July being the hottest month. During this period, temperatures often exceed 74°F, providing ample warm days for outdoor activities. In contrast, winter brings much cooler temperatures, lasting from the end of November to early March, with average daily highs below 43°F.
Snowfall is another component of Fort Wayne’s climate, with the city receiving an average of 30 inches (0.76 m) of snow per year.
Table of Contents
ToggleClimate Overview

The warmest period spans from late May to mid-September, with July being the hottest month, averaging a high of 83°F and a low of 64°F according to the National Weather Service.
The cold season lasts from late November to early March, with January being the coldest month, featuring an average high of 34°F and a low of 19°F. These temperature fluctuations underscore the city’s continental climate.
Seasonal Weather Patterns
Precipitation in Fort Wayne is distributed throughout the year, though May is the wettest month, averaging 4.3 inches of rain as per bestplaces.com. The driest month is February with 2.0 inches of rainfall. Autumn receives the most precipitation, constituting 31% of the annual total, whereas Spring tends to be drier with only 18%.
Extreme Weather Events
Summer months can bring strong thunderstorms, often accompanied by high winds and hail. Winter storms may result in significant snowfall and icy conditions. Despite these events, Fort Wayne avoids many natural disasters, maintaining a relatively stable and mild climate throughout most of the year.
Average Annual Rainfall
Month
Average Rainfall (inches)
January
2.48
February
2.06
March
2.46
April
3.75
May
4.47
June
4.20
July
3.89
August
3.95
September
2.94
October
2.85
November
2.93
December
2.36
Annual
38.34
- Annual Rainfall: Fort Wayne receives an average of 38.34 inches of rain annually, which is consistent with its classification as a region with moderate precipitation levels compared to other parts of Indiana. The city experiences rainfall throughout the year, with the highest amounts typically occurring during the late spring and early summer months.
- Wettest Months: May is the wettest month, averaging 4.47 inches of rainfall. This is followed by June with 4.20 inches, and August with 3.95 inches. These months align with peak agricultural activity, making the rainfall beneficial for crops.
- Driest Months: February is usually the driest month, with only 2.06 inches of rain. January and December also see lower precipitation levels, averaging 2.48 inches and 2.36 inches, respectively. These months coincide with colder temperatures and often snow, which contributes to overall moisture levels but less in liquid precipitation.
- Seasonal Distribution: Rainfall distribution shows a clear seasonal pattern with spring (April and May) and summer (June through August) being the wettest periods. The autumn and winter months experience lower precipitation, contributing to the varied climate conditions seen in Fort Wayne.
Monthly Precipitation Statistics
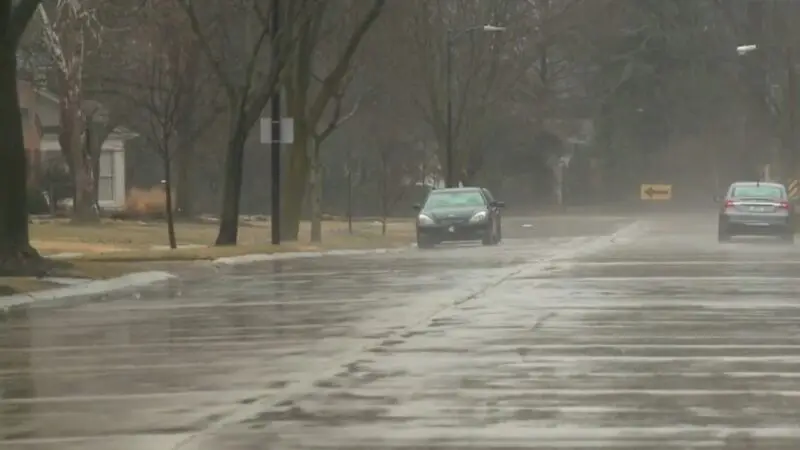
In Fort Wayne, precipitation levels fluctuate throughout the year. Data shows that August is the wettest month, receiving around 111 mm of rainfall. On the other hand, January tends to be the driest, with an average of 60 mm of rain.
The spring months, particularly April and May, also see significant rainfall. These months contribute to the overall annual precipitation, which averages around 1001 mm. Understanding the monthly breakdown can help in planning activities and managing resources effectively throughout the year.
Rainfall Distribution
Rainfall in Fort Wayne is unevenly distributed across the year. The heaviest rainfalls typically occur in the warmer months. During April, May, June, and August, heavy rains are common, providing a significant portion of the yearly total. This pattern affects agriculture, water supply, and daily life.
The distribution is influenced by various climatic factors, including seasonal changes and regional weather patterns. The data emphasizes the need for preparedness during peak months and offers insights into managing water resources more sustainably. The variability in rainfall can impact numerous sectors, making it crucial for the community to stay informed and prepared.
Fort Wayne vs. Indiana State Average
The warm season lasts from late May to mid-September, with temperatures often exceeding 74°F. The cold season runs from late November to early March, with temperatures typically staying below 43°F according to Weather Spark.
When compared to the Indiana state average, Fort Wayne’s annual precipitation is also noteworthy. The city receives approximately 40.5 inches of precipitation yearly. This is close to, but slightly lower than, the statewide average of about 42 inches.
Analyzing temperature patterns, Fort Wayne tends to be slightly cooler than the state average during summer months, with July temperatures peaking at 83°F, compared to the state average of around 85°F. Winter temperatures in the city generally align with statewide averages, making Fort Wayne a model representation of Indiana’s climate characteristics.
Regional Climate Variations
Geographical location plays a crucial role in Fort Wayne’s climatic conditions. Fort Wayne is situated in the northern part of Indiana, which contributes to its slightly cooler temperatures compared to the southern regions of the state.
The city experiences about 1029 millimeters (40.5 inches) of rainfall annually, comparable to other northern Indiana regions. However, it’s worth noting that southern Indiana experiences higher rainfall levels, often exceeding 45 inches per year according to Purdue University.
Wind and humidity also vary within the state. Fort Wayne has moderate humidity levels and wind speeds, making it less humid and windy compared to areas closer to Lake Michigan. Conversely, southern regions experience higher humidity levels, which can significantly impact comfort levels during hot summer months.
Regional differences in daylight and sunshine exposure also affect Fort Wayne’s overall climate experience. The northern location leads to marginally shorter daylight hours in winter and longer daylight hours during summer, compared to the southern parts of the state. This variation can influence seasonal activities and energy consumption patterns.
Agriculture and Farming
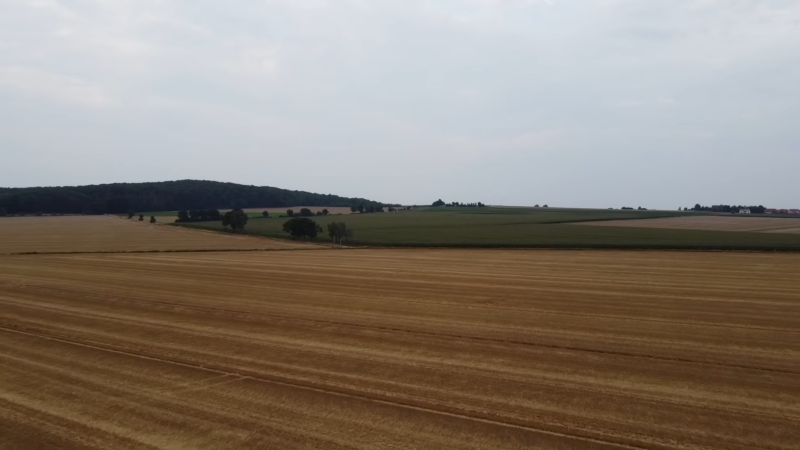
Rainfall plays a crucial role in the agricultural sector of Fort Wayne. Adequate precipitation is essential for crop growth, especially for water-intensive crops like corn and soybeans. The area receives varying amounts of rain throughout the year, which helps to sustain the overall fertility of the soil.
Farmers in Fort Wayne closely monitor rainfall patterns to plan their planting and harvesting schedules. May’s heavy rainfall of approximately 4.3 inches (ca. 11 cm) can sometimes lead to delayed planting, affecting crop yields. Conversely, drought conditions in drier months require irrigation solutions, raising operational costs for local farmers.
Urban Planning and Flood Control
Urban areas in Fort Wayne are designed to handle fluctuations in precipitation. City planners incorporate various water drainage systems to manage stormwater effectively. During heavy rainfalls, especially in August with its 111 mm of precipitation, these systems prevent flooding.
Efficient drainage infrastructure, including storm sewers and retention basins, helps manage excess rainwater. Flood control measures like levees and floodwalls are vital for protecting residential and commercial areas. These systems ensure that urban environments remain safe and functional, even during periods of increased rainfall.
Weather Data Collection and Sources
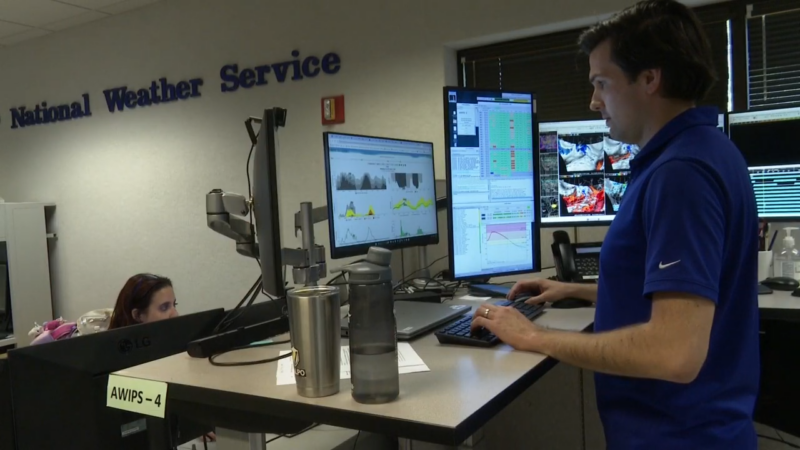
Meteorological stations are crucial for collecting precise climate data in Fort Wayne. These stations are strategically located, including major setups at places like Fort Wayne International Airport. They measure a variety of parameters such as temperature, wind speed, humidity, and precipitation.
Data from these stations are used to analyze daily weather patterns and yearly trends. For instance, average temperatures and high-temperature records like those reported in 1988 and 1934 are recorded and monitored continuously.
The data helps in forecasting weather conditions and assessing long-term climate changes. Meteorological stations also feed data to national databases, ensuring a robust collection of information across various time periods and geographic locations.
Predicted Weather Patterns
According to the NOAA Climate Projections, average temperatures could increase, leading to longer and hotter summers. Winter temperatures are expected to rise as well, reducing the duration and frequency of cold spells.
Rainfall patterns will also change. Future projections show an increase in heavy rainfall events, potentially causing flooding. The Indiana Climate Change Impacts Assessment indicates a rise in both annual and seasonal precipitation percentages, with significant increases during spring and fall.
Related Posts:
- What Can We Expect from the 27th Annual Pollution…
- Fort Wayne Population 2025 - Growth, Trends, and…
- 13 Must-See Attractions in Fort Wayne - A Complete Guide
- How Does the Fort Wayne Crime Rate Look Like in 2025?
- How to Use Reliable Data Sources for Climate and…
- How Indiana’s Attorney General Is Leading the Fight…


