


With a 2025 population of 114,651, Evansville has seen a slight decline, reflecting a broader trend influencing similar mid-sized cities according to World Population Review.
This shift is part of a pattern observed over recent years, as the city experienced a gradual reduction in residents, contributing to ongoing discussions about urban planning and economic strategies.
1. Racial and Ethnic Composition
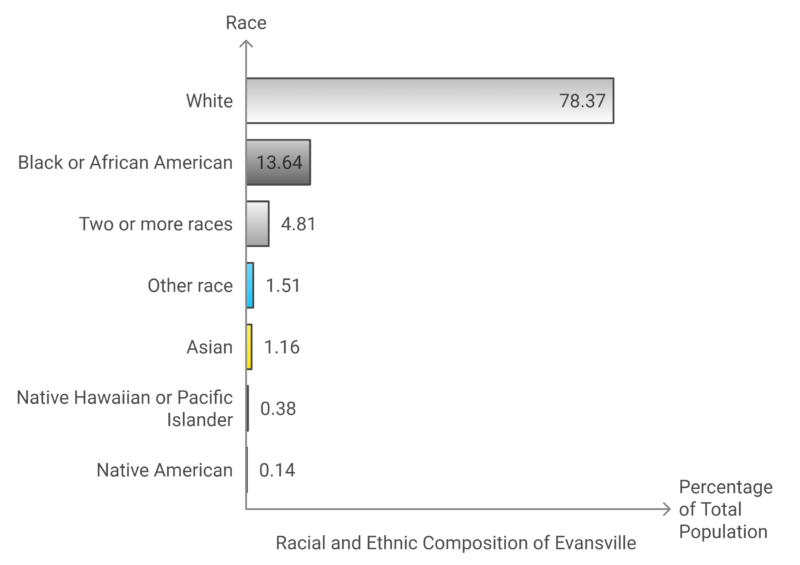
This table provides a breakdown of Evensville’s population by race, highlighting that the majority of the population identifies as White (78.37%), followed by Black or African American (13.64%).
Smaller groups include those identifying with two or more races (4.81%), other races (1.51%), and Asian (1.16%). Minor racial groups like Native Hawaiian or Pacific Islander (0.38%) and Native American (0.14%) make up less than 1% of the population.
2. Economic Aspects
Indicator
Value
Population (2025)
114,651
Annual Population Growth Rate
-0.59%
GDP Growth Rate (2024)
-0.25%
Unemployment Rate (Q3 2024)
3.6%
Median Household Income
$49,853
Personal Income Growth (2024)
4.3%
Manufacturing Share of Employment
14.2%
Manufacturing Share of Exports
51%
Median Home Value
$148,000
Poverty Rate
18.56%
High School Graduation Rate
34.72% (overall)
Evansville, Indiana, with a population of approximately 114,651 in 2024, continues to experience a slow population decline of 0.59% annually. The city’s economy is notably reliant on manufacturing, which contributes to 14.2% of total nonfarm employment and 51% of exports as the Indiana Business Research Center notes.
However, manufacturing, especially nondurable goods, has faced structural challenges, with real output projected to decline by 0.25% in 2024, reflecting broader economic headwinds according to BLS.gov.
Despite these challenges, personal income is expected to grow by 4.3%, which could mitigate some economic pressures. The unemployment rate is projected to be 3.6%, indicating a relatively stable labor market as per Data USA.
However, poverty remains a significant issue, with 18.56% of residents living below the poverty line, and educational attainment levels show that only 15.31% of residents hold a bachelor’s degree, further reflecting economic disparities.
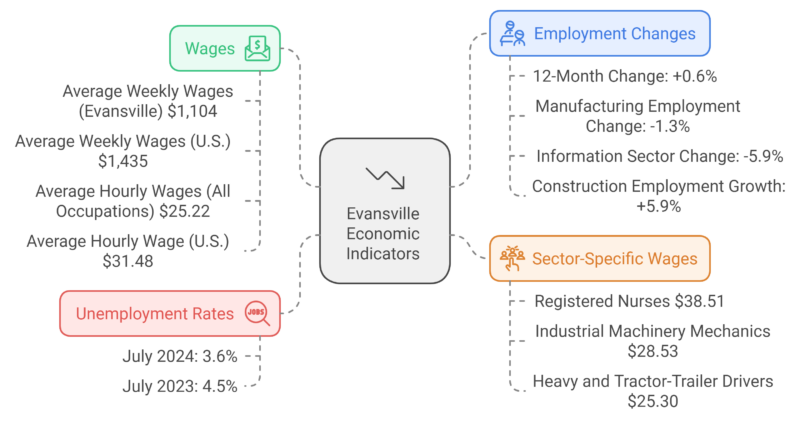
Evansville’s average weekly wage of $1,104 is below the national average of $1,435, reflecting the region’s lower wage levels compared to the national labor market. As of July 2024, the unemployment rate in Evansville stood at 3.6%, unchanged from the previous year.
Despite stable employment levels, some sectors, such as manufacturing, saw a 1.3% decline in employment, while information services dropped 5.9% over the past year. On a more positive note, construction employment increased by 5.9%, showing robust growth in this sector.
In terms of wage comparisons, workers in Evansville earn lower hourly wages compared to national averages. For instance, the average wage for registered nurses in Evansville is $38.51, compared to the U.S. average of $45.42. Similarly, industrial machinery mechanics earn $28.53 in Evansville, slightly below the national average of $30.62.
Employment Statistics in Evansville, IN (2024)
Employment Category
Number of Workers
% of Workforce
Year-over-Year Change
White-Collar Workers
41,581
72.83%
+0.5%
Blue-Collar Workers
15,514
27.17%
+1.6%
Self-Employed
3,941
6.9%
+12.1%
Private Companies
42,603
74.62%
-0.5%
Government Workers
4,694
8.22%
-3.7%
Not-for-Profit Employees
5,857
10.26%
+8.3%
In Evansville, 72.83% of the workforce is employed in white-collar jobs, including managerial, administrative, and professional occupations. The remaining 27.17% are in blue-collar roles, which have seen a 1.6% increase in year-over-year employment.
Additionally, 6.9% of the workforce is self-employed, reflecting a 12.1% rise in entrepreneurial activity in the city, indicating growing opportunities in small businesses.
The majority of workers (74.62%) are employed by private companies, though there has been a slight decline (0.5%) in this category. Government employment makes up 8.22% of the workforce but has dropped by 3.7%, while not-for-profit organizations employ 10.26% of the working population and have grown by 8.3% over the past year.
3. Household Information
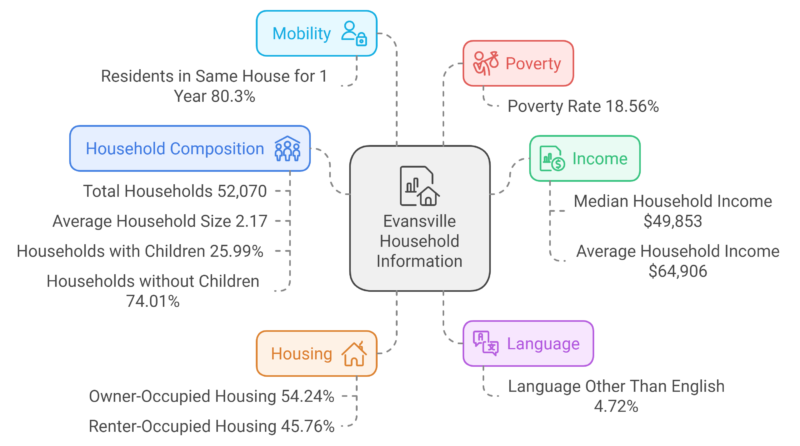
Evansville’s household structure and economic indicators reveal a relatively small average household size of 2.17 persons, reflecting national trends towards smaller household units. About 80.3% of residents have lived in the same home for at least a year, indicating residential stability.
The median household income is $49,853, with an average household income of $64,906, showing a gap between typical and higher-earning households.
This aligns with regional economic conditions, where Evansville’s per capita income stands at roughly 90% of the state’s average according to Census Reporter.
The poverty rate, at 18.56%, remains a challenge for the city, highlighting income inequality, which is further emphasized by the fact that 54.24% of housing units are owner-occupied, while 45.76% are rented. Additionally, 4.72% of residents speak a language other than English at home, primarily Spanish, reflecting the city’s growing linguistic diversity
4. Historical Population Growth
Evansville’s Growth in the 20th Century
Evansville, Indiana experienced significant changes in its population over the decades. Notably, in 1960, the population reached its peak at 141,543. This was a period of substantial growth, positioning Evansville as the 87th largest city in the United States at that time.
Trends in the 21st Century
Since the 1960s, Evansville’s population has gradually declined. By 2024, it has decreased, indicating an 18.5% reduction from the 1960 peak. Recent estimates show a downward trend, with a 0.59% annual decline as recorded in recent years.
Recent Changes and Projections
Between 2022 and 2023, the population change was minimal, but there was still a slight drop to 115,332. This steady decline reflects broader trends in urban population dynamics, commonly due to economic and demographic factors.
5. Age Distribution in Evansville
Age Group
Population
% of Total Population
Under 5 years
7,283
6.23%
5 to 9 years
6,581
5.63%
10 to 14 years
7,236
6.19%
15 to 19 years
6,231
5.33%
20 to 24 years
8,688
7.43%
25 to 29 years
9,764
8.35%
30 to 34 years
8,175
6.99%
35 to 39 years
7,298
6.24%
40 to 44 years
7,103
6.08%
45 to 49 years
5,930
5.07%
50 to 54 years
7,501
6.42%
55 to 59 years
7,721
6.60%
60 to 64 years
7,944
6.80%
65 to 69 years
6,522
5.58%
70 to 74 years
4,675
4.00%
75 to 79 years
3,266
2.79%
80 to 84 years
2,352
2.01%
85 years and over
2,636
2.25%
The median age in Evansville is 38.1 years, indicating a balanced age structure with a modest proportion of both younger and older residents. The largest group, 25 to 29 years old, accounts for 8.35% of the population, reflecting a significant presence of young adults, which may be related to the presence of educational institutions and the early stages of workforce entry.
A substantial portion of the population is aged 30 to 64 years (44.20%), forming the core of the workforce. Meanwhile, residents aged 65 and older make up about 16.63% of the population, with 2.25% of residents being 85 years and older, highlighting the aging segment that may require increased healthcare and social services.
The youth population (under 15 years) comprises 18.05%, reflecting future needs for education and family services according to Neilsberg’s article.
6. Educational Attainment Levels
Educational Level
Population
% of Total Population (25 years and older)
No High School Diploma
10,200
12.5%
High School Diploma
49,300
60.3%
Post-Secondary Degree (Associate’s, Bachelor’s, etc.)
22,300
27.3%
Bachelor’s Degree
10,600
13.0%
Master’s Degree
4,068
5.0%
Doctorate/Professional Degree
559
0.7%
In Evansville, Indiana, the majority of the population aged 25 and older has attained a high school diploma (60.3%), making it the dominant level of education. Only 12.5% of the population lacks a high school diploma, which is slightly higher than the state average. Around 27.3% of the population has achieved some form of post-secondary education, including associate, bachelor’s, and graduate degrees.
When comparing Evansville to Indiana at large, the city has slightly fewer residents with higher degrees. For instance, only 13.0% of residents have a bachelor’s degree, compared to higher state averages.
Educational attainment in Evansville indicates a significant population with vocational or high school-level qualifications, which correlates with the city’s strong reliance on industries like manufacturing and healthcare as per Statistical Atlas.
7. Housing Market Trends
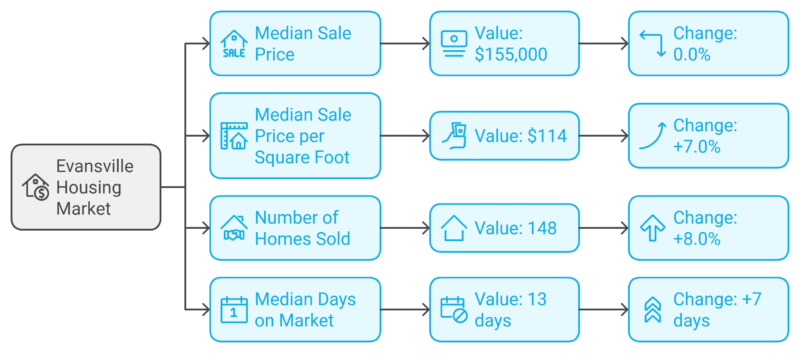
The housing market in Evansville, Indiana, has remained somewhat competitive despite fluctuations in other parts of the U.S. The median sale price for homes in August 2024 was $155,000, reflecting no significant change from the previous year.
However, the price per square foot increased by 7.0%, suggesting that while overall prices are stable, buyers may be paying more per unit of space according to Redfin.
One notable shift is the time homes spend on the market. On average, homes now stay listed for 13 days, which is a substantial increase from the 6 days recorded last year, indicating a slower pace in the housing market despite higher home sales. There were 148 homes sold in August 2024, an increase of 8.0% from the 137 homes sold in the same month last year.
8. Healthcare and Life Expectancy Rates
Healthcare Indicator
Value
Life Expectancy (Statewide)
75 years
Leading Cause of Death
Heart Disease
Healthcare Spending per Resident (Indiana)
$12,288
Uninsured Population (Indiana)
7.5%
Hospitals Serving Evansville
Deaconess Health, St. Vincent
Heart Disease Mortality Rate
190.5 deaths per 100,000
Drug Overdose Death Rate (Indiana)
41.0 per 100,000
Evansville’s healthcare system reflects broader state trends in Indiana, with several key indicators providing insight into the region’s health profile. The life expectancy in Indiana stands at around 75 years for those born in 2021, slightly lower than the national average of 77.5 years according to CDC.
Factors such as heart disease, which remains the leading cause of death, and rising mortality among younger age groups, have contributed to the state’s relatively lower life expectancy rates compared to the U.S. average as per the Indiana Business Research Center.
In terms of healthcare spending, Indiana ranks 19th among U.S. states, with $12,288 spent per resident in 2020. This spending includes contributions from businesses, households, and public programs such as Medicare and Medicaid.
Amid widespread underinvestment, how did Indiana manage to pass a $225M public health spending increase in 2023? @asknir of @IndianaUniv @FSPH_IU +coauthors explain and draw insights Indiana’s approach may hold for other states. Read the article: https://t.co/Z0E2Nj50VS pic.twitter.com/Ma0iQoIbog
— Health Affairs (@Health_Affairs) June 26, 2024
Access to healthcare is generally available through private insurance and government programs, though 7.5% of Indiana residents were uninsured as of 2021.
Health services in Evansville are provided by a variety of institutions, including Deaconess Health System and Ascension St. Vincent, which are among the largest healthcare providers in the region. The city is equipped to handle a broad range of healthcare needs, but similar to the rest of the state, chronic diseases such as diabetes, cancer, and respiratory issues pose ongoing challenges
9. Impact of Migration on Population

Migration has been a key driver of population changes in Indiana over recent years, particularly due to net in-migration. In 2023, Indiana saw a net inflow of nearly 22,500 residents, marking the third consecutive year that migration has contributed over 20,000 new residents annually as noted by some faculty researchers.
This migration trend has helped sustain the state’s population growth, especially in suburban areas around major metro centers like Indianapolis, which has seen strong inflows due to housing and employment opportunities. Counties in the Indianapolis metro area, such as Hamilton and Hancock, have been among the fastest-growing in the state, adding thousands of new residents each year.
However, while migration has bolstered Indiana’s growth, natural population increase (the difference between births and deaths) has been diminishing. In 2023, there were 7,508 more births than deaths, an improvement from the previous two years but still below pre-pandemic levels.
The state’s declining birth rates and rising mortality, particularly among working-age residents due to factors like drug-related deaths, have constrained natural population growth.
Rural areas, which had seen population declines between 2010 and 2020, have started to experience modest growth. In 2023, these areas recorded a net inflow of around 1,630 residents, reversing a decade-long trend of out-migration.
However, rural and mid-sized counties still face challenges from higher death rates than births, indicating that migration remains critical for population sustainability in these regions.
10. Crime Rates and Public Safety
Crime Type
Number of Crimes
Rate per 1,000 Residents
Violent Crimes
836
7.22
– Murder
25
0.22
– Rape
83
0.72
– Robbery
70
0.60
– Assault
658
5.68
Property Crimes
4,368
37.74
– Burglary
655
5.66
– Theft
3,257
28.14
– Motor Vehicle Theft
456
3.94
Total Crimes
5,204
44.96
Neighborhood Scout notes that Evansville, IN, has a total crime index of 4, making it safer than only 4% of U.S. cities. Violent crimes in the city are particularly high, with 7.22 violent crimes per 1,000 residents compared to the national average.
Notably, assault is the most common violent crime, at 5.68 per 1,000 residents. The city’s murder rate is 0.22 per 1,000, which is higher than the national average of 0.06.
View this post on Instagram
Property crimes are even more prevalent in Evansville, with 4,368 reported incidents, resulting in a rate of 37.74 per 1,000 residents. Theft is the most common property crime, making up the majority of the reported incidents, with 28.14 per 1,000 residents.
Evansville’s crime rates for both violent and property crimes are significantly higher than both the state and national averages, particularly when comparing the risk of becoming a victim of a property crime (1 in 26 in Evansville vs. 1 in 65 in Indiana).