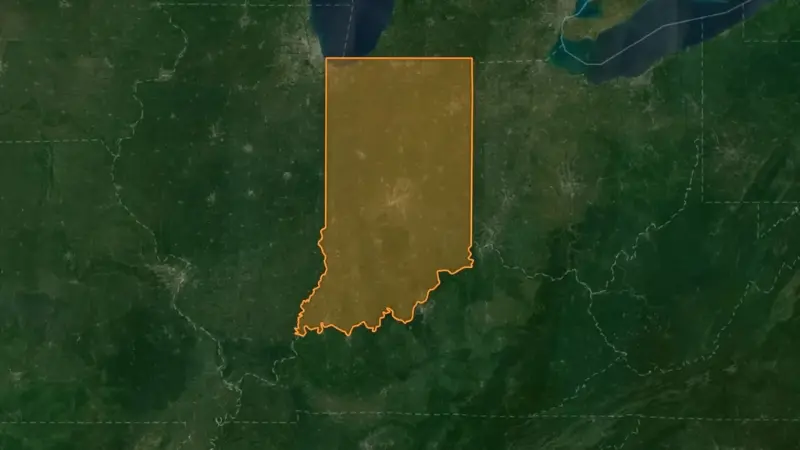
Indiana is the 17th most populous state in the U.S., with a population of 6.6 million according to the according to the World Population Review.
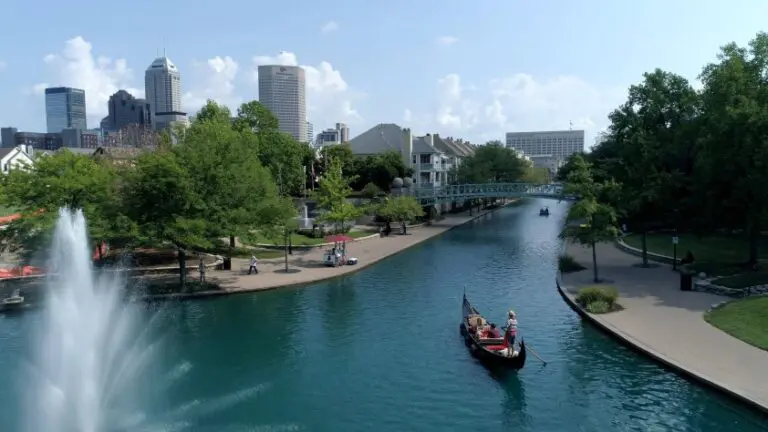
The largest city is Indianapolis, with over 853,000 residents, followed by Fort Wayne with over 260,000 residents.
Evansville is the third-largest city, with a population of 119,943 as of 2017, less than half of Fort Wayne’s.
South Bend is the only other city in the state with a population exceeding 100,000. Additionally, 74 cities in Indiana have populations ranging from 10,000 to 100,000.
Most cities in Indiana are classified as third-class cities, which have a city council and a clerk-treasurer.
Second-class cities, with populations between 35,000 and 600,000, have a city council and a clerk. Indianapolis is the only first-class city in the state.
Cities must have at least 2,000 residents to be incorporated under these classifications.
The smallest incorporated city in Indiana is Cannelton in Perry County, with an estimated population of 1,552
Table of Contents
TogglePopulation Data of the 10 Largest Cities in Indiana
Rank
City
2023 Population
2020 Population
Population Density (per sq mi)
Area (sq mi)
Growth Rate
Classification
1
Indianapolis
876,665
880,397
2,428
361.0
-0.3%
Township
2
Fort Wayne
271,865
268,067
2,457
110.6
0.69%
City
3
Evansville
114,651
115,644
2,421
47.4
-0.59%
City
4
Fishers
105,631
102,150
2,930
36.1
1.48%
City
5
South Bend
103,415
103,126
2,468
41.9
0.02%
City
6
Carmel
103,093
102,128
2,100
49.1
0.78%
City
7
Bloomington
78,761
79,044
3,388
23.3
-0.1%
City
8
Hammond
75,669
76,576
3,327
22.7
-0.69%
City
9
Noblesville
75,170
73,092
2,159
34.8
1.7%
City
10
Lafayette
71,372
71,208
2,430
29.4
0.22%
City
Indianapolis remains the largest city in Indiana, with a population of 876,665. However, its slight population decline (-0.3%) over recent years indicates stagnation or outward migration.
Noblesville (1.7%) and Fishers (1.48%) are the fastest-growing cities among the top 10, driven by suburban expansion and economic development.
Bloomington has the highest population density (3,388 per sq mi), despite being smaller in size (23.3 sq mi). Indianapolis, while the largest by area (361.0 sq mi), has a much lower density of 2,428 per sq mi.
Hammond (-0.69%) and Evansville (-0.59%) are among the cities experiencing a decline in population, possibly due to industrial decline or other economic factors.
South Bend and Carmel have similar population figures, both exceeding 103,000, but Carmel shows slightly stronger growth (0.78%).
Growth patterns suggest a shift toward suburban cities like Fishers and Noblesville, while traditional industrial cities such as Hammond and Evansville struggle with population retention.
10. Lafayette
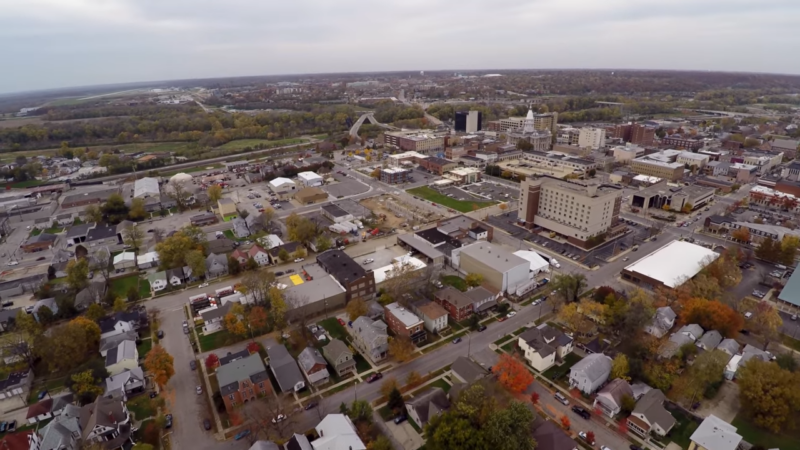
Lafayette, Indiana, has a 2025 population of 71,372, growing at an annual rate of 0.22%. Since the 2020 census, the population has increased by 0.88%. As the county seat of Tippecanoe County, Lafayette is a central hub in the area.
The average household income in Lafayette is $65,007, with a poverty rate of 16.47%. The median age of residents is 33 years, with males averaging 32.3 years and females slightly older at 34.2 years.
According to the most recent ACS data, Lafayette’s racial composition is predominantly White (78.57%), followed by Black or African American (9.37%), Two or More Races (5.23%), Other Races (4.37%), and Asian (2.36%). Native American and Native Hawaiian/Pacific Islander populations are minimal, comprising 0.11% and 0%, respectively.
Population Growth by Year
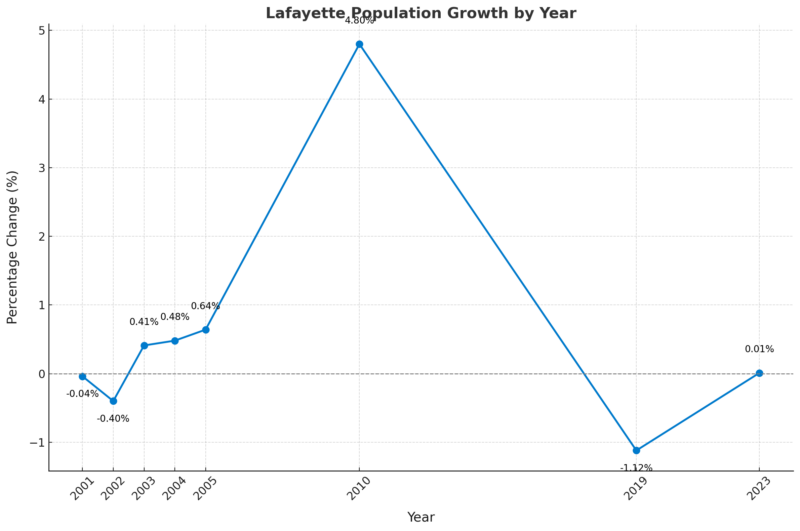
The highest annual growth occurred from 2009 to 2010, with a 4.80% increase, driven by economic or demographic factors.
Lafayette experienced its largest decline between 2018 and 2019, with a -1.12% decrease, suggesting potential population outmigration or economic shifts according to Neilsberg.
Recent years (2021–2023) show minimal fluctuation, with growth rates close to zero, indicating a plateau in population change.
Over the 23-year period, Lafayette saw an average annual growth rate of 0.71%, reflecting moderate, consistent development overall.
9. Noblesville
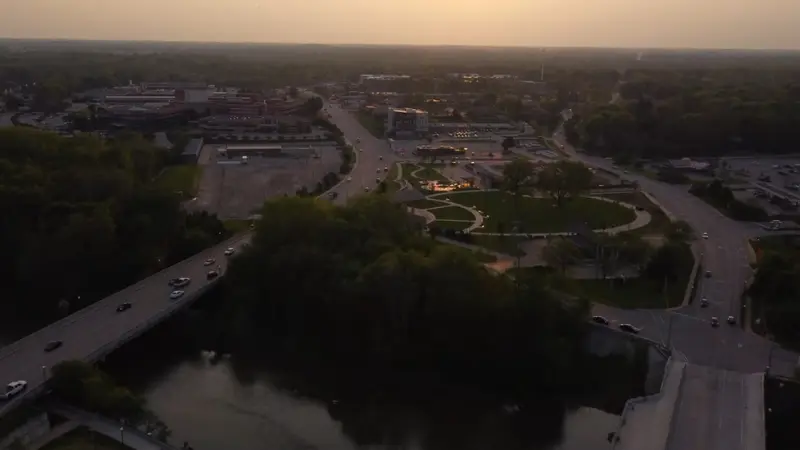
Located in Hamilton County, Indiana, has a 2025 population of 75,170 and serves as the county seat. The city is experiencing steady growth, with an annual growth rate of 1.7%. Since the 2020 census, which recorded a population of 70,152, Noblesville has grown by 7.15%.
The average household income in Noblesville is $122,329, and the poverty rate is relatively low at 5.47%. The median age is 34.4 years, with males averaging 32.9 years and females 35.4 years.
Data indicates that Noblesville’s population is predominantly White (85.62%), followed by Black or African American (5.32%), Two or More Races (5.22%), Asian (2.81%), and smaller percentages of Other Races and Native American populations.
Population Growth Rates (2000–2023)
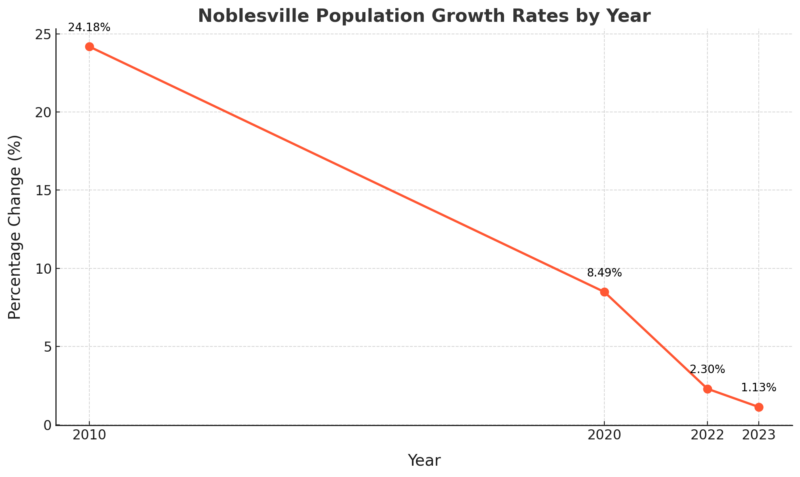
The largest annual growth was 24.18% in 2010, reflecting significant population expansion.
Neilsbergs research notes that between 2020 and 2023, growth rates have slowed but remain steady, ranging from 8.49% to 1.13%.
Noblesville continues to grow, though at a more gradual pace in recent years, reflecting long-term stability.
8. Hammond
Hammond, located in Tangipahoa Parish, Louisiana, has a population of 23,469 as of 2025. The city is growing rapidly, with an annual growth rate of 4.18%, and has experienced a 19.13% population increase since the 2020 census, which recorded 19,700 residents.
The average household income in Hammond is $64,570, but the city has a high poverty rate of 34.46%. The median age of residents is 26.8 years, with males averaging 24.8 years and females 28.8 years.
ACS data shows that Hammond’s racial composition is predominantly White (50.2%), followed by Black or African American (44.53%), Asian (2.43%), Two or More Races (1.86%), Other Race (0.92%), and Native American (0.06%).
Population Percent Changes
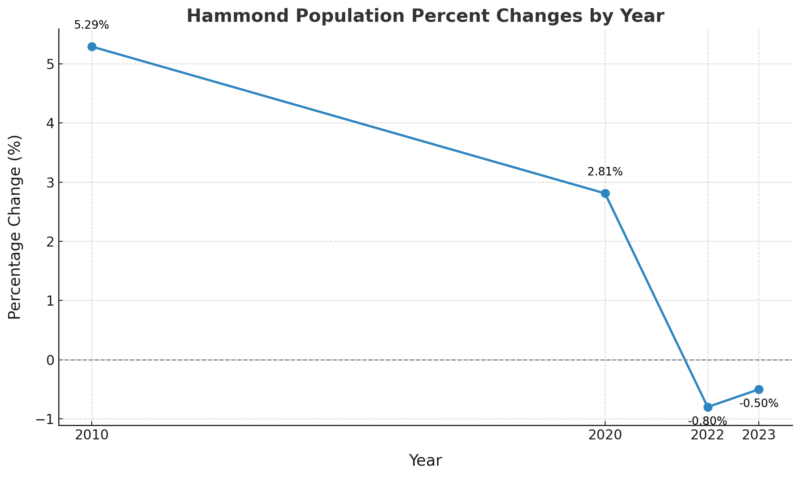
Hammond’s population peaked at 82,802 in 2000 and has steadily declined since, losing 6,609 residents over 23 years.
A notable increase of 5.29% occurred in 2010, but this growth was short-lived as the downward trend resumed.
From 2021 to 2023, the city experienced steady annual declines between 0.50% and 0.80%, indicating consistent outmigration or demographic shifts as per this data shows.
Hammond has not regained its peak population, and the trend suggests ongoing decline, signaling potential economic or community challenges.
7. Bloomington
Located in Monroe County, Indiana, has a 2025 population of 78,761 and serves as the county seat. The city is experiencing a slight decline, with an annual population decrease of -0.1%. Since the 2020 census, when the population was 79,077, Bloomington’s population has decreased by -0.4%.
The average household income in Bloomington is $71,517, but the city faces a high poverty rate of 31.08%. The median age of residents is 24.4 years for both males and females, reflecting its youthful population.
WPR data shows, Bloomington’s racial composition is predominantly White (79.16%), followed by Asian (10.53%), Black or African American (4.75%), Two or More Races (4.66%), and smaller percentages of Other Races, Native American, and Native Hawaiian or Pacific Islander populations.
Population by Years
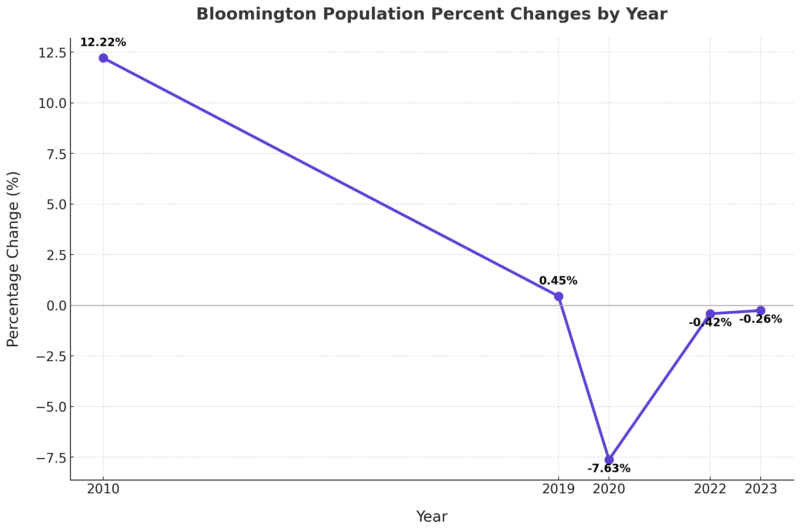
Bloomington’s population peaked at 85,610 in 2019, with a subsequent decline indicating a potential saturation or outmigration.
Neilsberg notes that a sharp drop of -7.63% occurred in 2020, likely due to external factors such as the pandemic impacting migration or census adjustments.
From 2021 to 2023, the population continues to decrease modestly, reflecting stabilization at a lower level rather than recovery.
Despite recent declines, the population grew by 8,087 over 23 years, showcasing moderate long-term expansion prior to the downturn.
6. Carmel
Carmel has become Indiana’s city of the future with its dramatic population growth in the past 50 years, but even Carmel had to start somewhere. https://t.co/edbVfVDMbs
— WRTV Indianapolis (@wrtv) November 28, 2024
Carmel, located in Hamilton County, Indiana, has a population of 103,093 as of 2025. The city is growing at a rate of 0.78% annually and has increased its population by 3.19% since the 2020 census, which recorded 99,905 residents.
Carmel boasts an average household income of $181,667 and a low poverty rate of 3.62%. The median age is 40.6 years, with males averaging 40 years and females 41.2 years.
World Population Review notes that Carmel’s racial composition is primarily White (78.77%), followed by Asian (11.34%), Two or More Races (5.06%), Black or African American (3.53%), Other Race (1.14%), Native American (0.08%), and Native Hawaiian or Pacific Islander (0.08%).
Age Distribution
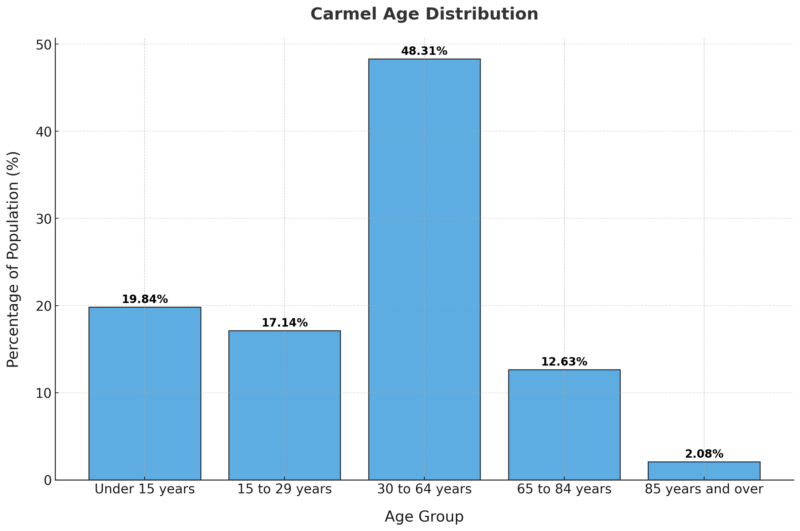
The majority of Carmel’s population (48.31%) is in the working-age range of 30 to 64 years, highlighting a strong labor force presence.
A significant portion of the population (19.84%) is under 15 years, indicating a family-friendly environment with many young residents.
About 14.71% of the population is aged 65 and above, reflecting a growing elderly demographic likely supported by Carmel’s economic stability and amenities.
The age distribution reflects a balanced community, accommodating families, working professionals, and retirees.
5. South Band
When you think of South Bend, Indiana, iconic images like the University of Notre Dame, the legacy of Studebaker, and the city’s Midwest charm often come to mind.
But South Bend is more than its famous institutions; it’s a city with steady growth, evolving diversity, and a unique balance of urban and suburban life.
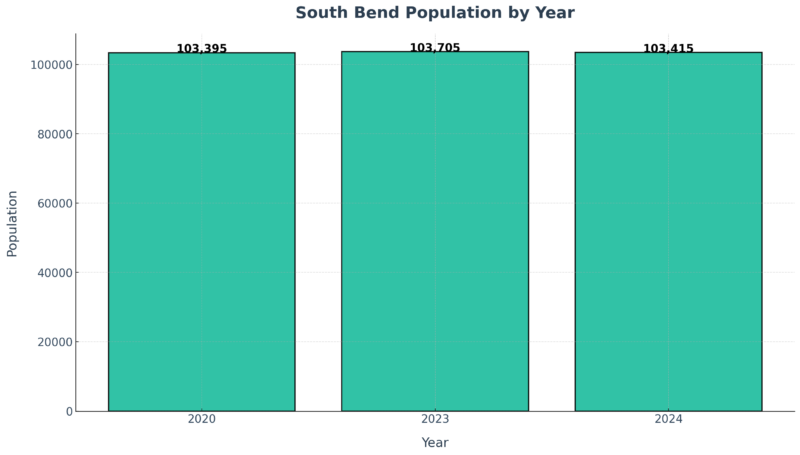
As of 2025, South Bend’s population is approximately 103,415—not explosive, but stable, reflecting a city that values sustainability while embracing change.
South Bend’s population has remained steady over recent years, with a modest annual growth rate of 0.02%.
While 2025 reflects a slight dip from 2023, the city has generally maintained its size, indicating stability without the pressures of rapid urbanization.
Population Density
Metric
Value
Population Density
596 people/sq mi
Total Area
458 square miles
With a population density of 596 people per square mile, South Bend offers a balance between urban amenities and open spaces.
The city’s moderate density allows residents to enjoy city life while retaining access to suburban and rural areas within the city limits.
Diversity in South Bend
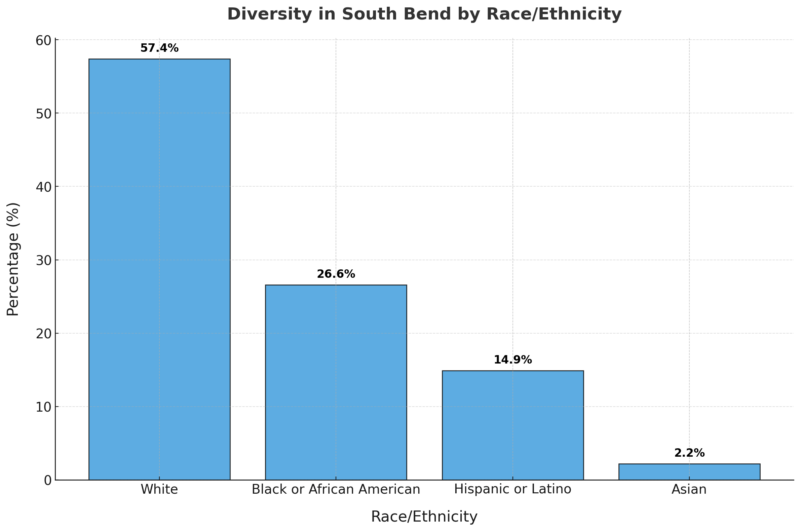
South Bend is a melting pot of cultures.
The largest racial group is White at 57.4%, followed by Black or African American residents at 26.6%, and Hispanic or Latino at 14.9%.
This diversity enriches the city’s cultural fabric, evident in its festivals, food, and community life.
4. Fishers
Fishers, Indiana, located in Hamilton County, has a 2024 population of 105,631.
The city is growing steadily at an annual rate of 1.48% and has increased its population by 6.18% since the 2020 census, which recorded 99,481 residents.
Known for its affluence and stability, Fishers boasts an average household income of $153,245 and a low poverty rate of 3.19%.
The median age is 37.1 years, with males averaging 36.5 years and females 37.7 years according to WPR.
Population and Growth
| Metric | Value |
|---|---|
| 2025 Population | 105,631 |
| Annual Growth Rate | 1.48% |
| Increase Since 2020 Census | 6.18% |
Fishers has experienced significant growth since 2020, adding over 6,150 residents. Its steady annual growth reflects its appeal as a suburban community with excellent living standards.
Economic and Age Demographics
Metric
Value
Average Household Income
$153,245
Poverty Rate
3.19%
Median Age (Total)
37.1 years
Median Age (Males)
36.5 years
Median Age (Females)
37.7 years
Fishers’ high average household income and low poverty rate underscore its prosperity. The median age of 37.1 years reflects a mature population balanced between working professionals and families.
Racial Composition
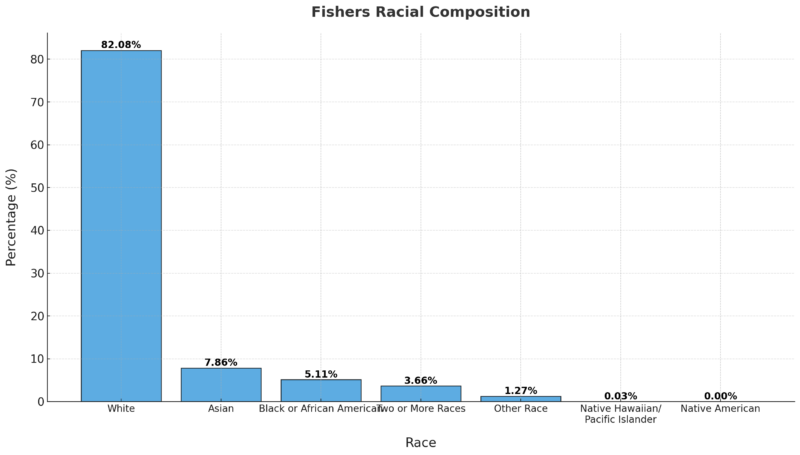
Fishers is predominantly White (82.08%) but has a growing Asian community (7.86%) and representation from other racial groups. This diversity adds to the cultural richness of the city while maintaining a majority White demographic.
3. Evansville
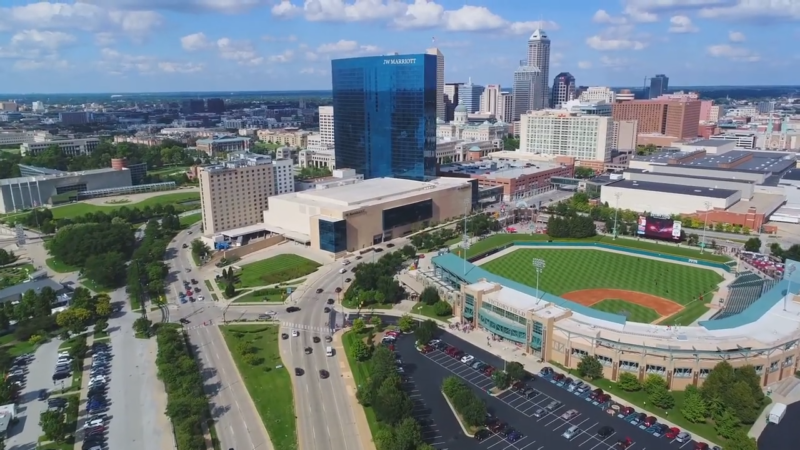
Evansville, located in Vanderburgh County, Indiana, had a population of 114,651 in 2025. The city, which serves as the county seat, is experiencing a population decline at an annual rate of -0.59%, with a total decrease of -2.32% since the 2020 census, which recorded 117,373 residents.
The average household income in Evansville is $64,906, and the poverty rate stands at 18.56%. The median age is 38.1 years, with males averaging 36.2 years and females 39.4 years.
Population and Growth
| Metric | Value |
|---|---|
| 2025 Population | 114,651 |
| Annual Growth Rate | -0.59% |
| Decrease Since 2020 Census | -2.32% |
Evansville’s declining population reflects demographic and economic challenges, with a significant loss of over 2,700 residents since 2020.
Economic and Age Demographics
| Metric | Value |
|---|---|
| Average Household Income | $64,906 |
| Poverty Rate | 18.56% |
| Median Age (Total) | 38.1 years |
| Median Age (Males) | 36.2 years |
| Median Age (Females) | 39.4 years |
The median age of 38.1 years reflects a relatively mature population. However, a poverty rate of 18.56% suggests economic challenges for a significant portion of the population, despite a moderate average household income.
2. Fort Wayne
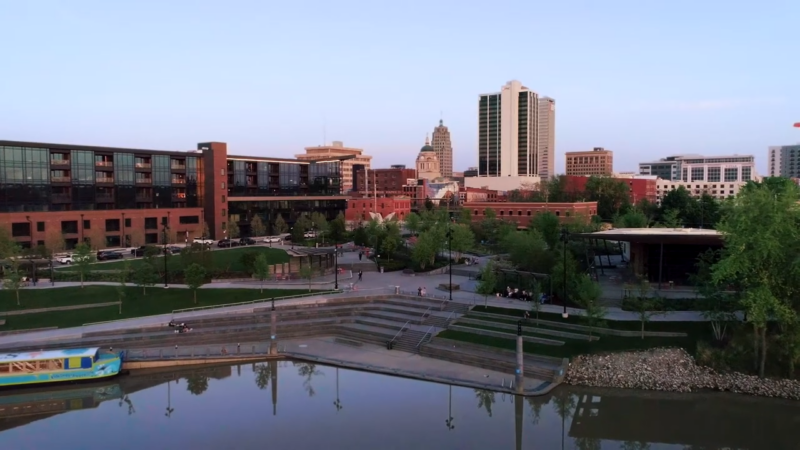
Fort Wayne, located in Allen County, Indiana, has a population of 271,865 as of 2025, growing at an annual rate of 0.69%. Since the 2020 census, the city has seen a population increase of 2.83%, adding 7,485 residents.
Known for its diverse community and cultural heritage, Fort Wayne is home to the largest population of Burmese Americans in the United States, with approximately 6,000 residents.
Nicknamed the “City of Churches” due to its 360 churches, with over half of its residents identifying as religious, primarily Catholic.
Population and Growth
| Metric | Value |
|---|---|
| 2025 Population | 271,865 |
| Annual Growth Rate | 0.69% |
| Increase Since 2020 Census | 2.83% |
Fort Wayne’s population growth reflects steady development, with a significant increase of 7,485 residents since 2020, signaling ongoing urban appeal and stability.
Economic and Age Demographics
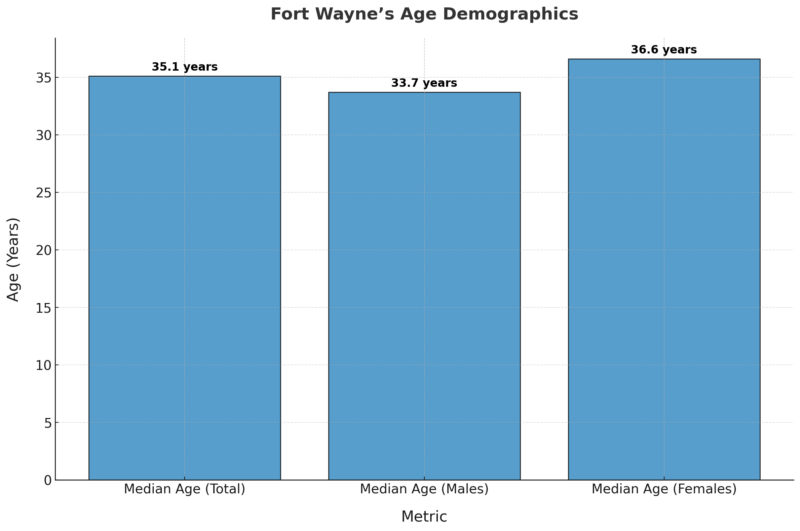
The median age of 35.1 years and the moderate average household income of $76,890 reflect a balanced demographic, with economic challenges indicated by a poverty rate of 15.16%.
1. Indianapolis
Indianapolis, Indiana, the bustling capital known for its iconic Indianapolis 500 and vibrant cultural scene, has a population of 876,665 as of 2025.
While the city is rich in history and diversity, it is experiencing a modest population decline of -0.3% annually, amounting to a total decrease of -1.18% since the 2020 Census.
Economic disparities and shifting demographics contribute to the city’s evolving landscape, creating both challenges and opportunities for growth.
Population and Growth
Metric
Value
2025 Population
876,665
Annual Growth Rate
-0.3%
Decline Since 2020 Census
-1.18%
Indianapolis has seen a slight population decline despite its strong cultural and economic infrastructure.
Understanding and addressing the causes of this trend will be crucial for sustaining future growth.
Population by Race
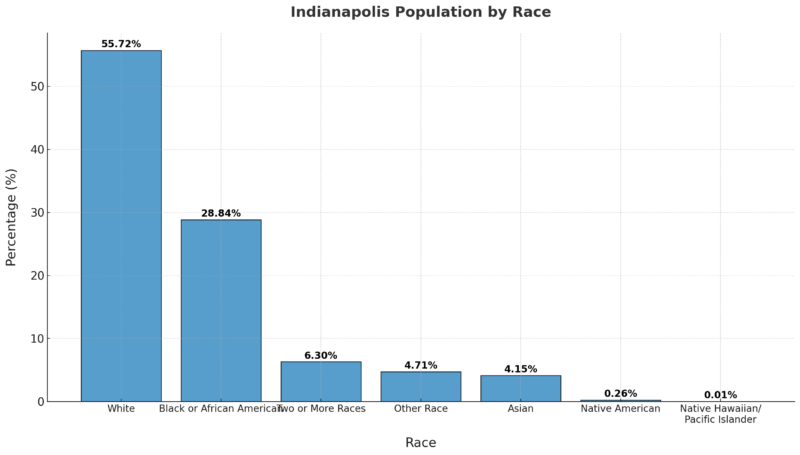
Indianapolis is a diverse city, with its largest racial groups being White (55.72%) and Black or African American (28.84%).
This diversity is a strength, reflecting the city’s rich cultural history and opportunities for inclusivity.
Methodology
- Data was sourced from reliable platforms like the World Population Review and the American Community Survey (ACS).
- Current and historical population trends were analyzed for accuracy.
- Economic indicators like income, poverty rates, and growth rates were included for context.
- Demographic breakdowns by race, age, and gender were summarized from the latest ACS data.
- Each city’s unique characteristics and challenges were highlighted using both quantitative and qualitative insights.
- Data was synthesized into concise tables and narratives to enhance readability and engagement.


